How the S&P 500 calculator works
Value at the end
Value = Amount × (1 + R_{1}) × (1 + R_{2}) × … × (1 + R_{n})
- R
- the S&P 500's total return in each calendar year, dividends included
Annualized return
Annualized = (Value ÷ Amount)1 ÷ n − 1
- n
- number of years
- With yearly additions
- the money-weighted rate that sets every deposit and the end value equal (internal rate of return)
Worked example
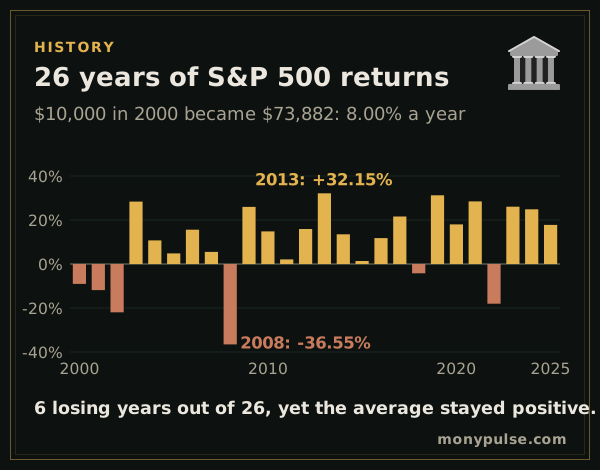
$10,000 invested in the S&P 500 at the start of 2000 grew to $73,882 by the end of 2025, with dividends reinvested. That is an annualized return of 8.00%, or 5.30% a year after inflation.
The ride was rough: the period began with three straight losing years in the dot-com crash and included the worst year of the span, 2008 (-36.6%). The market lost money in 6 of the 26 years. Simply keeping up with inflation would have required $19,298.
How to read the results
- Annualized return is the steady yearly rate that turns the starting amount into the ending value.
- After inflation removes the rise in prices, so it shows growth in buying power.
- Keeping up with inflation is what the money needed to grow to just to buy the same things, the line to beat.
- Years with a loss show how often patience was tested along the way.
Try a few starting points
Start in 1929 or 1973 to see how long recoveries took after big crashes, or start in 2009 to see a long bull market. Adding money each year, as many people do from their pay, changes the result because later money had less time to grow; the annualized return then becomes a money-weighted rate.
Past returns, future plans
History shows what happened, not what will happen. For planning, many people use a lower return than the long-run average, and the investment calculator lets you test a range. For workplace savings with an employer match, use the 401(k) calculator, and to measure a single investment of your own, the ROI calculator.
Assumptions and limits
- Returns are calendar-year total returns with dividends reinvested, from Professor Aswath Damodaran's historical data set (NYU Stern), 1928 through 2025.
- Money goes in at the start of a year and is measured at the end of a year. Yearly additions are made at the start of each year after the first.
- No fees or taxes. An index fund's small expense ratio would lower the result slightly.
- Inflation is the yearly change in consumer prices from the same data set through 2023 and the Bureau of Labor Statistics CPI-U for 2024 and 2025.
Frequently asked questions
What is the average return of the S&P 500?
From the start of 1928 to the end of 2025 the S&P 500 returned about 10% a year with dividends reinvested, before inflation. After inflation it was about 6.8% a year. Individual years ranged from a 52.6% gain in 1954 to a 43.8% loss in 1931.
Does this include dividends?
Yes. The returns are total returns, which assume every dividend was reinvested. Price changes alone would show a noticeably lower result over long periods.
How often has the S&P 500 lost money in a year?
In 26 of the 98 calendar years from 1928 to 2025. Losses over longer holding periods have been much rarer, which the calculator lets you check for any span of years.
Why is the annualized return lower than the average of the yearly returns?
Losses hurt more than equal gains help: a 50% drop needs a 100% gain to recover. The annualized return, also called the compound annual growth rate, is the rate your money actually grew at.
Can I see 2026 returns?
Not yet. The calculator uses full calendar years, and 2026 will be added once the year's total return is final.
Sources and method
- Historical Returns on Stocks, Bonds and Bills (January 2026 update, data through 2025) · Aswath Damodaran, NYU Stern School of Business
- Consumer Price Index · U.S. Bureau of Labor Statistics
Formulas and figures checked against these sources on November 11, 2026. The calculator runs entirely in your browser; nothing you type is sent to us or stored. Results are estimates for education, not financial, tax or legal advice, and MonyPulse is not a lender, tax preparer or investment adviser. Found an error? Tell us. See how we build and test our calculators and our editorial standards.