How the Stock Average calculator works
Average cost per share
Average = (Σ shares × price + fees) ÷ Σ shares
Shares to buy to reach a target average
New shares = Current shares × (current average − target) ÷ (target − new price)
- target
- must be between the new purchase price and your current average
Worked example
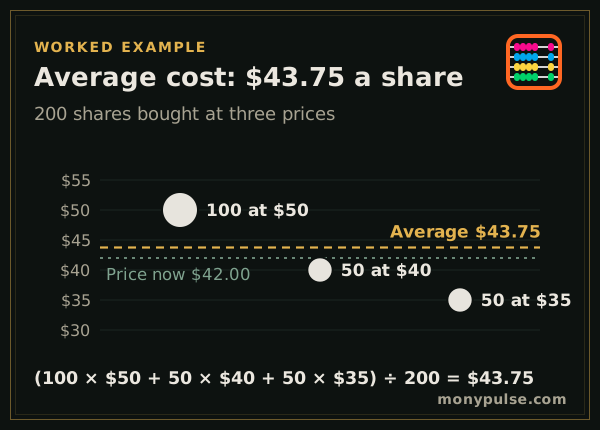
You bought 100 shares at $50, then 50 more at $40 and another 50 at $35. You now own 200 shares that cost $8,750.00, an average of $43.75 a share. At today’s $42 price the position is worth $8,400, a loss of $350, and the stock has to climb back to $43.75 for you to break even.
To bring the average down to $40 by buying at $30, you would need 200 × (43.75 − 40) ÷ (40 − 30) = 75 more shares, costing $2,250.
Averaging down: a tool, not a rule
Buying more at a lower price lowers your average cost, so a smaller rebound gets you back to even. It also puts more money into a single stock that has fallen for a reason. Before averaging down, ask whether you would buy the stock today if you didn’t already own it, and how large the position will be in your portfolio afterward.
Dollar-cost averaging
Investing a fixed amount on a schedule buys more shares when prices are low and fewer when they are high, so your average cost ends up below the simple average of the prices you paid. Enter each scheduled purchase as a row to see your average cost so far.
Related calculators
To work out profit when you sell, use the stock profit calculator with your average cost as the buy price. For the tax on the sale, use the capital gains tax calculator, and for a regular investing plan over many years, the investment calculator.
Assumptions and limits
- Every purchase is of the same stock or fund, and no shares have been sold.
- Commissions, if you enter them, are added to the cost of each purchase.
- Stock splits are not adjusted for. After a split, enter the split-adjusted shares and prices.
Frequently asked questions
How do I calculate the average cost of a stock?
Multiply the shares in each purchase by the price paid, add the results together with any fees, and divide by the total number of shares. Buying 100 shares at $50 and 100 at $40 gives an average of $45.
What does averaging down mean?
Buying more shares of a stock you own after its price has fallen, which lowers your average cost. It reduces the price the stock must recover to for you to break even, but it also adds money to a position that is losing.
How many shares do I need to buy to lower my average?
Enter the price you can buy at and the average you want under Plan another purchase. The calculator solves for the number of shares and the cost. The target has to sit between the new price and your current average.
Is my average cost the same as my tax cost basis?
Not always. For stocks, the IRS treats shares sold as the first ones bought unless you identify specific shares, so the basis used for a sale can differ from the average. Mutual funds can use an average-cost method. Check what your broker reports.
Sources and method
- Publication 550, Investment Income and Expenses · Internal Revenue Service
- Publication 551, Basis of Assets · Internal Revenue Service
Formulas and figures checked against these sources on November 11, 2026. The calculator runs entirely in your browser; nothing you type is sent to us or stored. Results are estimates for education, not financial, tax or legal advice, and MonyPulse is not a lender, tax preparer or investment adviser. Found an error? Tell us. See how we build and test our calculators and our editorial standards.