How the Income Percentile calculator works
Percentile
Your income is placed between the two published percentiles around it, on a logarithmic scale
- Household points
- 10th, 20th, 40th, 50th, 60th, 80th, 90th and 95th percentiles of 2025 household income
- Worker points
- 10th, 25th, 50th, 75th and 90th percentiles of usual weekly earnings × 52
Worked example
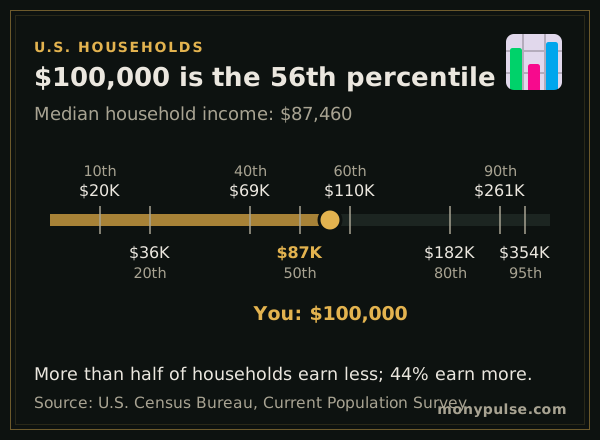
A household earning $100,000 a year ranks at about the 56th percentile of U.S. households: it earns more than roughly that share of all households. The median household earned $87,460 in 2025, so this household is a bit above the middle.
The same $100,000 as one person’s full-time salary ranks much higher among workers, around the 75th percentile, because household income often combines two or more earners.
Household vs. individual income
The Census Bureau measures household income: everyone in the home, before taxes. The Bureau of Labor Statistics measures the usual weekly earnings of individual full-time employees. The two answer different questions, so the calculator lets you choose:
- Household income shows your family’s standing, the figure most comparisons of “middle class” use.
- My earnings as a full-time worker shows how your own pay compares with other full-time workers.
Income percentiles at a glance
The results list the published income at each percentile, from the 10th to the 95th for households and the 10th to the 90th for workers. The gaps widen near the top: moving from the 80th to the 90th household percentile takes nearly $80,000 more a year.
Related calculators
Income is only half the picture; wealth often tells more. Compare your net worth with others your age in the net worth calculator. To convert your pay into other periods, use the salary calculator, and to see what a raise would do to your rank, try the raise calculator.
Assumptions and limits
- Household income is money income before taxes for everyone in the household, as the Census Bureau measures it; it excludes capital gains and non-cash benefits.
- Worker figures cover full-time wage and salary workers only, not the self-employed or part-time workers.
- Between published points the percentile is estimated, so treat it as approximate to within a few points. Above the highest published point the result is shown as a top share.
Frequently asked questions
What income is the top 10% in the U.S.?
For households, the 90th percentile of 2025 income was about $261,300, so a household above that earned more than 90% of U.S. households. The top 5% started at about $354,000.
What is the median household income?
About $87,460 in 2025, according to the Census Bureau. Half of U.S. households earned more and half earned less.
What do full-time workers typically earn?
The median full-time wage and salary worker earned $1,232 a week in the third quarter of 2026, about $64,000 a year. The top 10% earned at least $2,919 a week, about $152,000 a year.
Should I compare my household or my own pay?
Compare household income if you share expenses with a partner or family, and use the worker comparison to see how your own paycheck ranks against other full-time employees.
Does this account for where I live?
No. These are national figures. Incomes and living costs are higher in many coastal metro areas and lower in rural areas, so the same income can feel very different from place to place.
Sources and method
- Income in the United States: 2025 · U.S. Census Bureau
- Table 5. Quartiles and selected deciles of usual weekly earnings of full-time wage and salary workers · U.S. Bureau of Labor Statistics
Formulas and figures checked against these sources on November 11, 2026. The calculator runs entirely in your browser; nothing you type is sent to us or stored. Results are estimates for education, not financial, tax or legal advice, and MonyPulse is not a lender, tax preparer or investment adviser. Found an error? Tell us. See how we build and test our calculators and our editorial standards.